Friday, May 25, 2012

Risk v Reward

Metals Momentum

After not really having much to write about over the past few months as shorts have been the working trade, now that I am seeing a potential market shift with room for a profit to the upside, and all my shorts are now closed, I wanna map out the reasoning for taking a risk going long right now. There is always risk in any open market position you take and it is important to be aware of all risks in whatever investment vehicles you choose, and manage those risks accordingly.

The metals have been chopping around after the recent downside break. Gold has been hovering around 1550 and silver pressing towards it's previous support/low of the range around $27.15 (spot) hit in the last week of 2011. Yesterday, as gold was hanging around right below $1550 resistance, as soon as the NYMEX closed, gold easily moved above $1550 shooting almost $15 higher in 30 min & easily staying above it today.


Concurrently, silver hit an intraday low of $27.12 (spot) and bounced off the low end of it's range and has been steadily increasing 


I started going long at $28.35 and put stops in at $26.85. I figure if silver breaks the low end of it's range, I'll give it a little bit of a cushion and pushed it back about .30 to $26.85. If it breaks then it's probably going lower and that's about as much risk as I'm interested in taking on this trade. I see upside potential of $30 resistance, and we'll see how the market responds when it gets there.

Not that I usually pay much attention to the fundamentals in too much detail, but I think this thing with Greece possibly leaving the European Union has the potential to have a huge effect on the US Dollar and in turn on the precious metals which are priced in dollars. Maybe I'm not understanding the situation as the analysts on TV because they all seem to think the opposite of what I'm about to say. 

I'm speculating, that with all the toxic debt on Greece's books, if the European Union were to rid itself of that debt then there would be a major strengthening of the Euro currency, which having an inverse relationship with the US Dollar would result in a lower dollar and an overall strengthening of precious metals. Seems like a pretty basic logical series of cause and effect right? If I'm missing something here, someone please inform me. Anyways, I think we've got a lot of volatility on the horizon and that's a beautiful thing! Best of Luck!

Adam Laigo
Semper Pacific Wealth Strategies
metalsmomentum@gmail.com

Wednesday, February 15, 2012

Gold, Silver, and the US Dollar: A Trend, Consolidation, and a Reversal

METALS MOMENTUM

Looking at the news and looking at price reaction, there sure seems to be a lot of head scratching when it comes to precious metals and the US dollar right now. Today in the fed minutes, it was released that a lot of the fed governors are open to further bond buying, but due to steadily recovering economic numbers, it doesn't seem like something they will need to do anytime soon. Non-farm payroll  increased 243,000 net jobs in January. That helped lower the unemployment rate for the fifth straight month, to 8.3%. Also, car sales are up, as is consumer borrowing. This is not at all surprising when the FOMC rate is at the lowest in history and in the last meeting it was announced that the fed won't raise rates until late 2014. Still, even with all this positive economic data, the dollar has failed to show any follow through strength, and precious metals continue to hold at current levels.

So what in the world is a trader to do? Time to go back to the charts...


The US Dollar is pretty self explanatory from a long-term trend standpoint. I asked my five year old daughter, "Which ways this one going sweetie, up or down?" Without even looking at the volume changes or bar formations she said, "Down Daddy!" Ah the market intuition of a 5 yr old! If you really want to  break it down, the US Dollar has been in a downtrend since the Nixon shock in August 1971. Recent bounces are not surprising, considering the market has lost about 34% since 2001 on the open market. The recent price movement is surprising when you try and analyze the fundamentals. With all the positive economic data coming out recently, why is the dollar making only a half-hearted bounce here? Who knows. What I do know is that this most recent bar on the monthly chart looks like a reversal bar. After making highs of almost 2.5% higher than the open, the market settled negative for the month. The push higher on the single bar as well as this most recent bounce have happened on steadily decreasing volume, which implies the crowd just isn't there to support the movement. I think if the US Dollar is really going to recover, there needs to be a high volume breakout to the upside and soon. If all this positive data is failing to help the Dollar recover, whats going to happen when there's negative data? (If you've been in a cave the past few years, see chart for details.)


This is my favorite chart of them all. I've always believed that whatever gold does, the rest of the complex is going to follow. Maybe not on a day by day basis and maybe not from a percentage or volatility standpoint, but certainly from an overall directional standpoint. As long as I've been a metals bug, silver has been my go-to for the swings, but gold is the anchor. It does not experience as much price or percentage volatility as the rest of the precious metals. Depending on your style of investing, volatility can be very important in trading. Silver may only be up $3 in the past year, but it's been as high as $49.50 and as low as $20...that's a great trading range! Gold, however, has been much less volatile. When I look at that gold chart, 1 word comes to mind: consistency.

The beautiful long-term uptrend (LTUT) has yet to be violated by anything other than a head fake. Even when gold drops in price, as it has off of previous highs in the past 6 months, this consistent trend has remained true. The STDT sounds like something bad from a weekend in Vegas, but it's the short-term downtrend. In addition to being broken this past month, right after the LTUT was getting tested, and unconvincingly broken, it looked like the market was forming a descending triangle. For a descending triangle to work, it usually needs to breakout about 3/4 of the way to its apex. The longer it goes after that, the less likely of a break, as demonstrated in gold and as we will see again shortly in silver. As long as gold continues to hold it's long-term uptrend intact, it looks like a great investment to me.

Silver's weekly chart is very similar to what we just saw on gold's. Not only did the price fail to break support at the appropriate time (3/4 to apex) on the triangle, but after breaking $30 support, it failed to really follow through and make a new trading range lower before coming back above $30 only 3 weeks later. There was a great short opportunity there if you were following that $30 break, but only for a very small amount with tight stops and the market only got as low as $27.15.
On the daily chart, we can see that silver is continuing to trade in a range, but a couple things stand out to me. First, the market is starting to develop strong resistance at $34 as opposed to the $35 high end we were seeing for the past few months. In addition, there has been a serious tightening in price volatility over the past 3 weeks. Remember, the tighter range and the longer time frame of consolidation, the bigger and more reliable the breakout is going to be.

Don't forget to manage your risk with stops. Always have a plan A and a plan B. Best of Luck!
-AJL

Adam Laigo
Semper Pacific Wealth Strategies
metalsmomentum@gmail.com
Twitter: @PrcsMtlsGuy

Saturday, February 4, 2012

Potential Silver Cup and Handle

Metals Momentum 

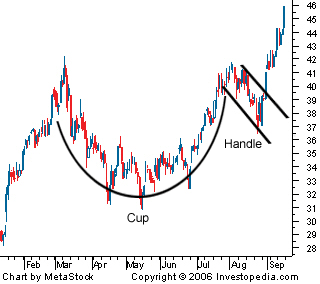
With non farm payroll numbers coming out slightly better than expected on Friday and the unemployment rate dropping by 0.2%, we saw a slight pullback in the price of precious metals. This begins what could potentially be the "handle" of a "cup and handle," an extremely bullish formation. First, let's examine the definition of a cup and handle before looking at the current silver chart. The fine people at investopedia.com do an excellent job of defining a cup and handle:


Definition of a cup and handle:
A pattern on bar charts resembling a cup with a handle. The cup is in the shape of a "U" and the handle has a slight downward drift. The right-hand side of the pattern has low trading volume. It can be as short as seven weeks and as long as 65 weeks.

As the stock comes up to test the old highs, the stock will incur selling pressure by the people who bought at or near the old high. This selling pressure will make the stock price trade sideways with a tendency towards a downtrend for four days to four weeks... then it takes off. Below is an example of a cup and handle chart pattern:
Cup and Handle


Investopedia explains 'Cup and Handle'

A couple points on trying to detect cup and handles:   Length - Generally, cups with longer and more "U" shaped bottoms, the stronger the signal. Avoid cups with a sharp "V" bottoms.    Depth - Ideally, the cup should not be too deep. Also, avoid handles which are too deep since the handles should form in the top half of the cup pattern.    Volume - Volume should dry up on the decline and remain lower than average in the base of the bowl. It should then increase when the stock finally starts to make its move back up to test the old high.    Retest (of old high) - doesn't have touch or come within a few ticks of old high. However, the further the top of the handle is away from the highs, the more significant the breakout needs to be.

While this definition given by investopedia.com  uses a stock chart for their example, I believe that all charting patterns are relative whether it's a stock, commodity, currency, or any free trading open market. A chart is a chart is a chart.

Let's take a look at Silver's potential cups:

chart provided by kitco.com

I've drawn the two cups I see forming. The smaller one looks a little better formed. If a true cup and handle is forming here, look for continued price sell-off going into next week. Support could come anywhere in this range of $30 - $33/oz, but gut instinct tells me that if it is indeed forming a handle, support will be found somewhere between $32 - $33/oz. 

I maintain my position that no new positions should be opened until there is confirmation of a breakout, but if you're feeling adventurous, it might be worth the risk to open a small percentage of your new long positions when/if silver finds support in this trading range and begins moving up. The more conservative approach would be to wait until there is a confirmed breakout over $34 (the lip of the cup) or the even more prudent move would be to wait until silver is over major resistance of $35. You may be a little late to the party by waiting, but if this formation comes to fruition, chances are there will be a fairly decent percentage move to the upside and a new trading range established at higher prices. As with any trade, it's always a good idea to put in a stop loss. Actual price points of stop losses should vary depending on your entry point.

All technical patterns are sort of self fulfilling prophesies. In other words, we cannot say that it is true cup and handle until the pattern completes and the market begins it's breakout over resistance. I'm just as prepared to reopen shorts if the market confirms breakout below range support at $30/oz again. No one knows for sure whether the market is going to go up or down, it's just a good idea to have a plan either way. Best of Luck!
-AJL

Adam Laigo
Semper Pacific Wealth Strategies
metalsmomentum@gmail.com
Twitter: @PrcsMtlsGuy


Wednesday, January 25, 2012

Fed Causes Knee-Jerk Reaction

Metals Momentum

Today was a pivitol day, as the Federal Reserve pushed their outlook to late 2014 before an increase in FOMC interest rates...CHEAP MONEY!!! The basic idea goes: lower rates = lower US dollar. Lower US Dollar = higher precious metals. You can guess on the following intraday charts when the announcement was made.

Intraday charts provided by http://www.kitco.com/

This week, silver moved back into it's previous trading range of $30 - $35/oz. Today's gold settlement over $1700 is key, not just from the price resistance that has developed there over the past 4 months but also from the psychological resistance that whole numbers have on prices. Remember, there were many weeks of consolidation at these levels very recently. From a technical analysis view, nothing has changed for silver, although the recent downtrend on gold's daily chart was broken on high volume with today's knee-jerk reaction. Fundamentally, the environment of long term inflation has been magnified by the US Dollar due to the Fed's new policy of excess transparency. My bias for the metals long-term continues to remain bullish. However, until this period of consolidation ends, I recommend waiting until confirmed breakout over $35 to enter new longs. Best of Luck! -AJL

Adam Laigo
Semper Pacific Wealth Strategies
metalsmomentum@gmail.com
Twitter: @PrcsMtlsGuy

Wednesday, December 14, 2011

Silver Breaks Out!

Metals Momentum
After 11 weeks plus of consolidation, silver is breaking out of it's tight trading range to the downside. I've always considered consolidation kind of like the gunpowder before a shot, or, if you have a pot of water boiling with a lid on it, when the lid is removed, it's going to have some steam behind it! The longer the period of consolidation, the bigger the breakout is going to be. Any readers that would like to discuss or see further examples of consolidation's effect on a market, feel free to contact me. For now, let's take a quick look at what silver's been doing on the daily chart.

Today, we saw a high percentage, high volume breakout of the trading range. Also the moving averages are rolling over. It's important to understand that silver has traded outside of it's range a couple times in the past. It has even settled below and broken out of the range early in it's consolidation. Immediately afterwards, silver went back into it's trading range of $30 - $35/oz. Just because a market breaks out of it's range does not guarantee there will be follow through. As demonstrated in these earlier examples, a breakout could be a head fake and return quickly to the trading range. Before making a trade decision and either closing your longs or opening shorts, you need confirmation of the breakout, i.e., follow through selling. If silver does not return to the outlined trading range or bounce above $30/oz, then we have confirmation of a breakout and we can expect to see some more selling happen very quickly. The HUGE spike in volume implies that there is a crowd behind the selling pressure.

It is difficult to determine a fair target or where the next nearest level of support is. This is because silver did not trade in the $20 - $30 range for very long on it's way up and therefore did not have an opportunity to develop much support. My gut tells me $25 due to the minor support shown on the weekly chart and also the psychological support and resistance that the crowd puts on whole numbers.


Think about gold trading between $300 - $500 for 25 years before breaking out of it's range in 2005. 25 years of consolidation has resulted in a major price change in the past 6 years for gold. Think about summer 2010, where silver traded between $17.50 -$18.50 for months. A very very tight trading range of only a dollar and four months of build up with a breakout the first week of September led to silver jumping to $49/oz. Consolidation is fuel to a fire, and a breakout of consolidation has always been one of my favorite and most reliable trading patterns. Combine high volume on the breakout with moving averages rolling over and silver failing to break the top end of it's range multiple times, and I believe the third wave of selling Ive been looking for has arrived. Best of Luck! AJL

Adam Laigo
Semper Pacific Wealth Strategies
metalsmomentum@gmail.com
Twitter: @PrcsMtlsGuy

Saturday, November 26, 2011

Volume Interpretation in Silver

Metals Momentum

Volume Interpretation

I hope you had a Happy Thanksgiving. With US markets having a shortened week, there is naturally going to be less volume than we would see in a full trading week. With all trading vehicles, if you are dealing with a speculative and price changing market, it is important to take volume and open interest into consideration. Volume helps us to understand liquidity available in a market and whether or not a crowd is behind price movements. As a personal rule, I am generally wary of exaggerated price movement in a volume-shortened week.

When dealing with futures markets, there are other things to take into consideration, such as trader’s rolling out of a spot month prior to expiration and moving into the next liquid contract. This can be demonstrated in this last week simply by comparing the Dec 2011 Silver with the Mar 2012.

(Silver, Dec 2012)


(Silver, Mar 2012)

While the price movements are virtually identical, the volume and open interest tell opposing stories, both decreased in the spot contract while increasing in the March 2012. While shortened Holiday trading certainly contributed to the decrease in the spot month, we must also take expiration into consideration which is clearly demonstrated in March’s increase.

The bottom line for me is, the question of why a market is doing something is less important than understanding what it’s doing and how to respond to it. On that note, it is therefore important to take both charts into consideration with respect to trading. Clearly, silver is in a period of consolidation and congestion with a tighter price range than it has experienced in the past year. Lowering volume and lowering open interest during a tight period of consolidation is usually indicative of a break out. Both market months agree that there has been a recent spike in volume on down days with drops in volume on the up days. Silver also closed very close to low of the day, only $.10 higher than it’s low of the day and week. Not a very good sign if you are a long buyer right now.

The purpose of this article is not to predict what prices are going to do from here, but to try to read the signs of what it’s doing and encourage preparation in the case that certain market conditions are met. In this case, your actions should be reflective of your personal strategy. If you have the means to steadily accumulate regardless of price and are a long-term bull that does not need to take price swings into consideration, your strategy is different than if you have limited risk available to you.  You need to know how much you are willing to put at risk or where your risk tolerance limits are whenever you are in any type of trading market or financial vehicle that involves price fluctuations. If I were long, I would be selling and going short if silver confirmed a break out of it’s trading range to the downside with a buy stop a little over $31. A long position should hope for a bounce between here and $30 with continued consolidation between $30 - $35/oz. The longer the consolidation, the more strength it’s showing at these levels and the higher likelihood of a market breakout to the upside.

Know one can knows for sure what the market is going to do or which direction it is going to break out of. I believe there are a number of signs that show an increased likelihood of a breakout to the downside and the market going lower before it goes higher. Be prepared either way. Best of Luck to you!

Adam Laigo
Semper Pacific Wealth Strategies
metalsmomentum@gmail.com
Twitter: @PrcsMtlsGuy

Sunday, November 20, 2011

Silver Synopsis


Metals Momentum

The long term fundamentals remain the same for the precious metals, including a long term downtrend in the value of the US Dollar, global economic uncertainty and high oil prices to name a few of many. The purpose of this article however is to break down the markets trading patterns and provide more in depth technical analysis based on chart patterns. Lets take a look at the weekly chart on silver.


Silver has been trading in a range between $30 -$35 an ounce for the past 8 weeks or so after it’s last sell off. Over the last 2 weeks it has tested near the $35 mark but failed multiple times to settle above it resulting in selling pressure, including a little over $3 drop between Wednesday and Thursday.

After a 176.33% increase ($17.92 - $49.52) over the course of 8 months, it became necessary for this market to correct and/or consolidate to digest it’s gains before this long term uptrend could continue. Looking at the first correction the 1st week of May, Silver dropped from it’s highs all the way down to $35.28 close in a week. It does not matter if it’s precious metals, a commodity, currency, or any other trading market. When you have that much of a sell off in that short of a period of time, it usually isn’t finished in a single wave. It took until the 3rd week of September to kick in but there was a clear 2nd wave of selling which puts us into our current range of $30 - $35 an ounce.

After 2 major sell offs, the bias is for this market to break it’s range to the downside and have 1 more wave of selling. There has been failure to break above resistance in both gold and silver followed by selling pressure towards the lower end of the trading range. The increase in volume and open interest in the last week implies a increased opening of positions short. Unless you’re working with nominal trading costs and have the time available to trade the volatility, I would recommend waiting for this market to tip it’s hand and break outside of this range before taking a position.

For bulls, the longer it consolidates and trades in this range the better. This will give the market time to develop further support and strength at these levels. Wait for a confirmed breakout out of this range above $35 before purchasing with stops under $34. For bears, wait for confirmed breakout below $30 support before shorting with stops above $31. Remember, just because a market trades outside of a range does not necessarily confirm a breakout. Best of Luck

Adam Laigo
Semper Pacific Wealth Strategies
MetalsMomentum@gmail.com
Twitter: @PrcsMtlsGuy